Free Access
Fig. 17
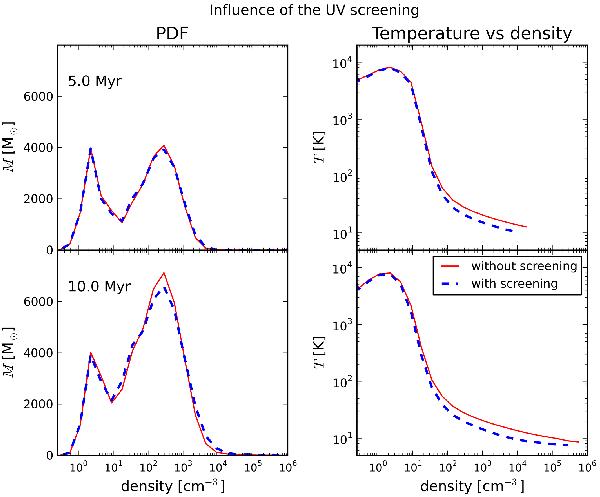
Comparison of the PDF of gas (left panel) and the corresponding temperature per density bin (right panel) at t = 5 Myr (top) and at t = 10 Myr (bottom) for the cases with and without screening.
Current usage metrics show cumulative count of Article Views (full-text article views including HTML views, PDF and ePub downloads, according to the available data) and Abstracts Views on Vision4Press platform.
Data correspond to usage on the plateform after 2015. The current usage metrics is available 48-96 hours after online publication and is updated daily on week days.
Initial download of the metrics may take a while.