Free Access
Fig. 11
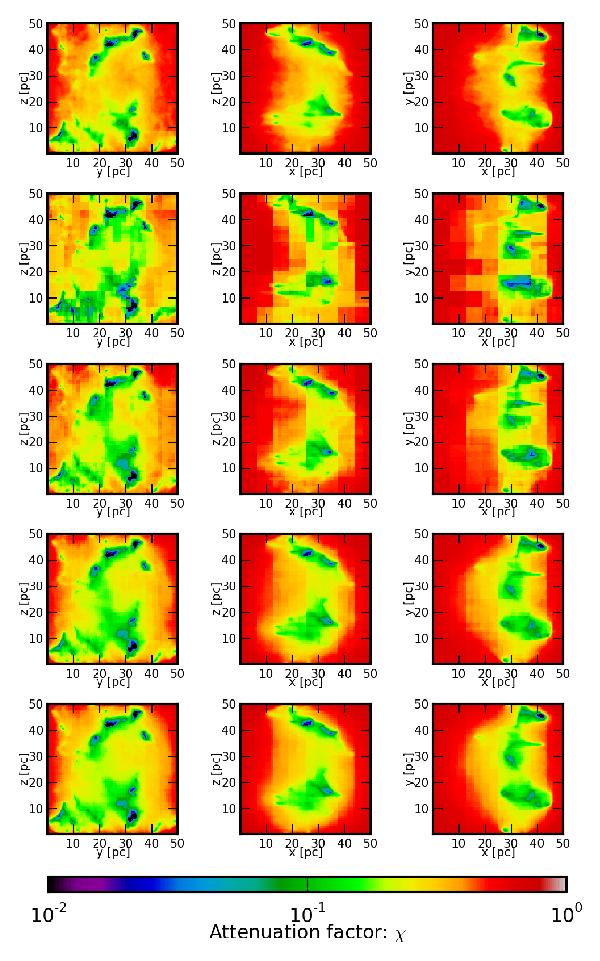
Extinction maps as seen by the cells in the midplanes. On the top we show the reference, calculated with the ray-tracing method. The other maps (from top to bottom) have been calculated with the tree-based method using 6, 12, 40, and 84 directions.
Current usage metrics show cumulative count of Article Views (full-text article views including HTML views, PDF and ePub downloads, according to the available data) and Abstracts Views on Vision4Press platform.
Data correspond to usage on the plateform after 2015. The current usage metrics is available 48-96 hours after online publication and is updated daily on week days.
Initial download of the metrics may take a while.