Fig. 10
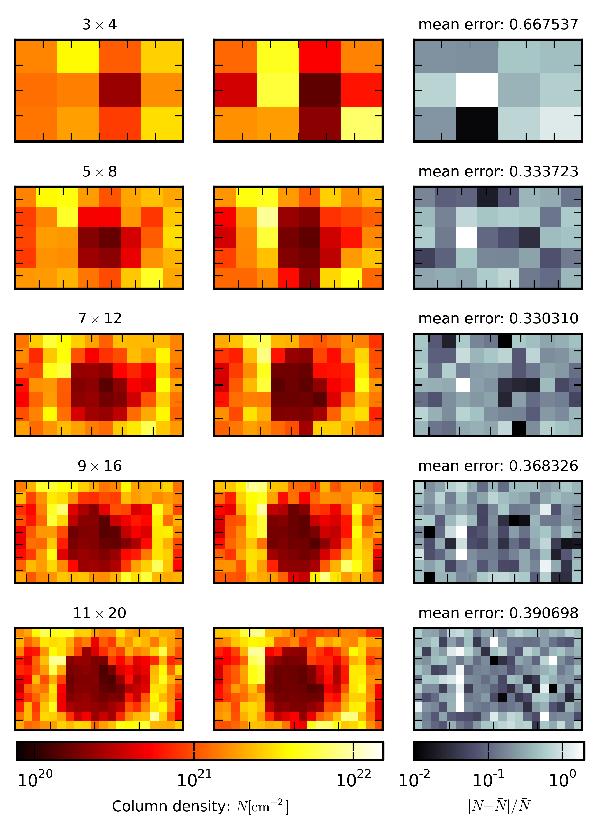
Column densities for the 4π sr as seen by a cell sitting at the center of the turbulent cloud. As in Fig. 6, the horizontal axis is the azimuthal angle φ (from 0 to 2π), and the vertical axis corresponds to cosθ. On the left we present the reference maps calculated using the gather approach. The panels in the center present the maps calculated using the tree-based method, and on the right we present the error maps calculated according to Eq. (12). From top to bottom: using 12, 40, 84, 144, and 220 directions.
Current usage metrics show cumulative count of Article Views (full-text article views including HTML views, PDF and ePub downloads, according to the available data) and Abstracts Views on Vision4Press platform.
Data correspond to usage on the plateform after 2015. The current usage metrics is available 48-96 hours after online publication and is updated daily on week days.
Initial download of the metrics may take a while.