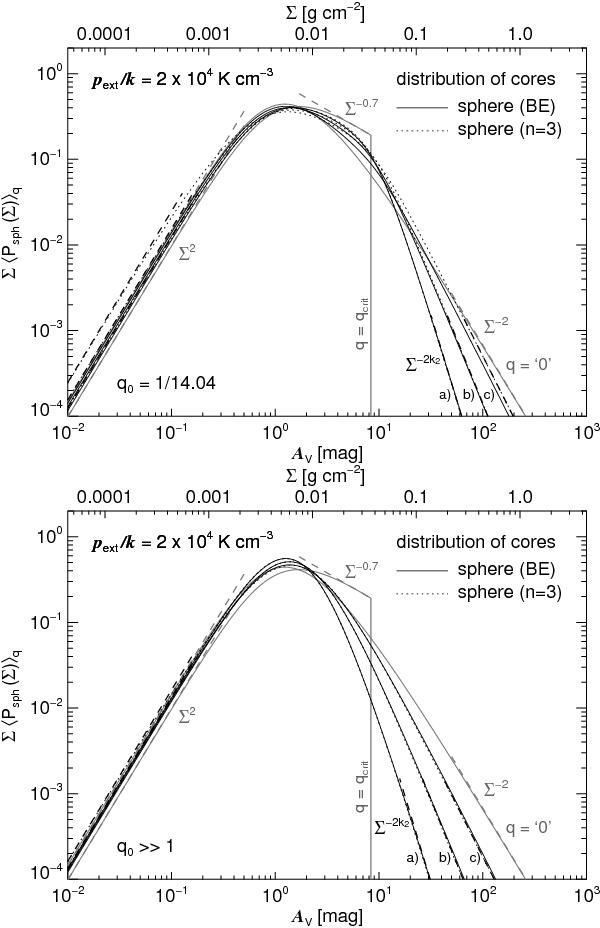
Fig. 9

Mean PDF of the mass surface density for an ensemble of cores assumed to be Bonnor-Ebert spheres with a distribution of gravitational states or pressure ratios q-1 as given in Eq. (53). For comparison the mean PDF is also derived for spheres with an analytical density profile as given in Eq. (1) with n = 3. The characteristic pressure ratio of the probability distribution of the gravitational states is either q0 = qcrit ~ 1/14.04 of a critically stable sphere (top panel) or q0 ≫ 1 (bottom panel). The various curves labeled a), b), and c) correspond to different power indices k2 assumed to be 2.0, 1.5, and 1.2. The power k1 = 2 and the smoothness parameter γ = 2 are the same in all calculations. The black dashed lines are power-law approximations of the PDFs in the limit of low and high mass surface densities for an analytical density profile with n = 3 (Appendix E.1). The external pressure is assumed to be pext/k = 2 × 10⁴ K cm-3. Also shown are the PDFs of a critically stable sphere and a sphere with infinite overpressure (gray lines and gray annotation). The corresponding power-law asymptotes of the PDFs of single cores in the limit of low (Eq. (34)) and high (Eq. (39) and Eq. (40)) mass surface densities are shown as gray dashed lines.
Current usage metrics show cumulative count of Article Views (full-text article views including HTML views, PDF and ePub downloads, according to the available data) and Abstracts Views on Vision4Press platform.
Data correspond to usage on the plateform after 2015. The current usage metrics is available 48-96 hours after online publication and is updated daily on week days.
Initial download of the metrics may take a while.


