Fig. 7
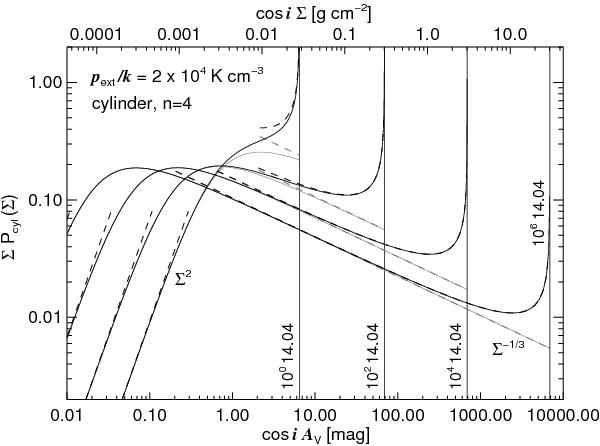
PDF of the mass surface density of isothermal self-gravitating pressurized cylinders for various overpressures. The vertical line marks the pole position of the PDFs and is labeled with the corresponding pressure ratio q-1. The asymptotes at high and low mass surface density are shown as black dashed lines. The gray curves are the corresponding asymptotic PDFs (Eq. (43)) where the pole is removed. The power-law asymptotes at high mass surface densities are shown as gray dashed lines.
Current usage metrics show cumulative count of Article Views (full-text article views including HTML views, PDF and ePub downloads, according to the available data) and Abstracts Views on Vision4Press platform.
Data correspond to usage on the plateform after 2015. The current usage metrics is available 48-96 hours after online publication and is updated daily on week days.
Initial download of the metrics may take a while.