Fig. 6
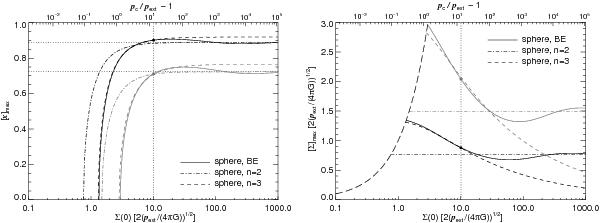
Normalized impact parameter (left-hand panel) and mass surface density (right-hand panel) at the maximum of the PDF of the mass surface densities of Bonnor-Ebert spheres, given as a function of the central mass surface density. The gray and black curves correspond to the logarithmic and the linear pdf. The values are compared with the corresponding impact parameters and mass surface densities of pressurized spheres with a density profile as given in Eq. (1) with n = 2 and n = 3. At low central mass surface densities the maximum of the PDF is at impact parameter [ x ] max = 0 and the curves in the right-hand panel follow the long dashed line where [ Σ ] max = Σ(0). The location of the critically stable Bonnor-Ebert sphere is marked by a vertical dotted line and the corresponding normalized impact parameters and mass surface densities at the PDF maximum as filled circles. The horizontal dotted lines in the left panel are the asymptotic values of the impact parameters of the PDF maximum of Bonnor-Ebert spheres in the limit of high overpressure. The overpressures shown in the upper axis are only valid for the Bonnor-Ebert sphere.
Current usage metrics show cumulative count of Article Views (full-text article views including HTML views, PDF and ePub downloads, according to the available data) and Abstracts Views on Vision4Press platform.
Data correspond to usage on the plateform after 2015. The current usage metrics is available 48-96 hours after online publication and is updated daily on week days.
Initial download of the metrics may take a while.