Fig. 3
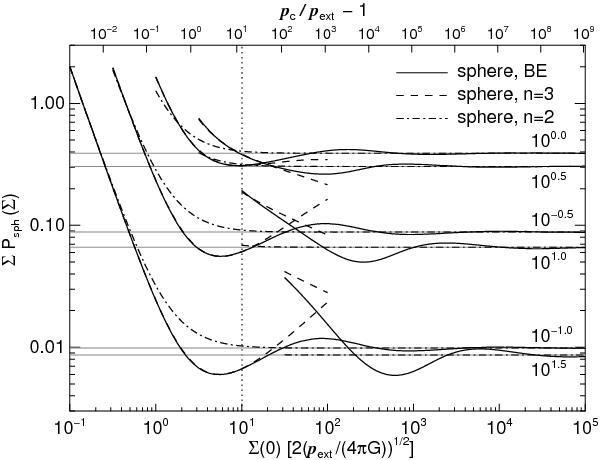
Probabilities of a number of mass surface densities through Bonnor-Ebert spheres shown as a function of the central mass surface density. The curves are labeled by the corresponding mass surface density given in units of ![]() . The probabilities are compared with those of analytical density profiles as given in Eq. (1) with n = 3 and n = 2. The probabilities for n = 3 are only shown for
. The probabilities are compared with those of analytical density profiles as given in Eq. (1) with n = 3 and n = 2. The probabilities for n = 3 are only shown for ![]() where the analytical density profile becomes a valid approximation of the density profile of a Bonnor-Ebert sphere. The overpressures given in the upper axis are only valid for Bonnor-Ebert spheres. The gray lines show the asymptotic probability for Bonnor-Ebert spheres in the limit of infinite overpressure. The vertical dotted line marks the location of the critically stable Bonnor-Ebert sphere.
where the analytical density profile becomes a valid approximation of the density profile of a Bonnor-Ebert sphere. The overpressures given in the upper axis are only valid for Bonnor-Ebert spheres. The gray lines show the asymptotic probability for Bonnor-Ebert spheres in the limit of infinite overpressure. The vertical dotted line marks the location of the critically stable Bonnor-Ebert sphere.
Current usage metrics show cumulative count of Article Views (full-text article views including HTML views, PDF and ePub downloads, according to the available data) and Abstracts Views on Vision4Press platform.
Data correspond to usage on the plateform after 2015. The current usage metrics is available 48-96 hours after online publication and is updated daily on week days.
Initial download of the metrics may take a while.