Fig. 7
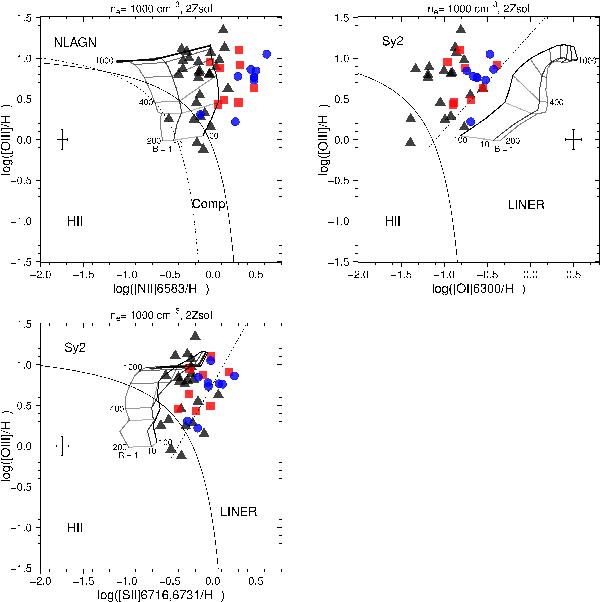
Same as Fig. 6 but showing the Allen et al. (2008) grids of shock-ionisation models. These grids have been generated assuming a shock+precursor model with twice solar metallicity and pre-shock density of ne = 1000 cm-3. Gridlines corresponding to 3 values of magnetic field (B = 1, 10 and 100 μG) and 9 shock velocity values (vs = 200, 300, 400, 500, 600, 700, 800, 900 and 1000 km s-1) are shown in the figure. vs increases always from bottom to top with 3 values (200, 400 and 1000 km s-1) indicated in the figure. As in the case of Fig. 6, the gridlines these are grey-coded from “light-grey” to black, with light-grey and black corresponding to the lowest and highest values of B and vs respectively. The symbols and colors are the same as in Fig. 6. (A color version of this figure is available in the online journal.)
Current usage metrics show cumulative count of Article Views (full-text article views including HTML views, PDF and ePub downloads, according to the available data) and Abstracts Views on Vision4Press platform.
Data correspond to usage on the plateform after 2015. The current usage metrics is available 48-96 hours after online publication and is updated daily on week days.
Initial download of the metrics may take a while.