Fig. 6
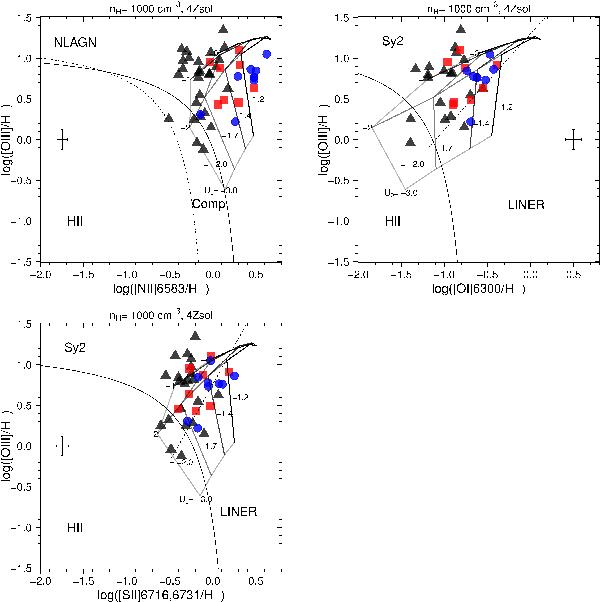
Standard optical diagnostic diagrams showing the classification scheme of Kewley et al. (2006). The solid curves are the theoretical “maximum starburst line” derived by Kewley et al. (2001) as an upper limit for star-forming galaxies. The dashed curve in the [NII] diagram is the Kauffmann et al. (2003) semi-empirical lower boundary for the star forming galaxies, while the dashed lines in the [SII] and [OI] diagrams represent the empirical boundary lines between Seyfert 2 galaxies and LINERs. The Groves et al. (2004) grids of dusty, radiation pressure-dominated models are also plotted in the figure. These grids have been generated assuming four times solar metallicity (4 Z⊙) and hydrogen density of nH = 1000 cm-3 (see the text for a justification on the selection of these parameters). Gridlines corresponding to five values of ionising parameter (U0 = 0, −1, −2, −3, −4) and four values of power law index (Fν ∝ να, α = −1. 2, −1.4, −1.7, −2.0) are shown in the figure. To help the reader follow the gridlines these are grey-coded from “light-grey” to black, with light-grey and black corresponding to the lowest and highest values of U0 and α respectively. Over-plotted on the diagrams are the results of our kinematic study. Black triangles are the line ratios corresponding to the narrow components, red squares correspond to the intermediate components and blue circles represent the broadest kinematic components. For clarity, no individual error bars are shown in the figure. However, to give an idea of the uncertainty associated with the line ratio measurements a cross symbol indicates the median of all line ratio errors in each respective diagram. (A color version of this figure is available in the online journal.)
Current usage metrics show cumulative count of Article Views (full-text article views including HTML views, PDF and ePub downloads, according to the available data) and Abstracts Views on Vision4Press platform.
Data correspond to usage on the plateform after 2015. The current usage metrics is available 48-96 hours after online publication and is updated daily on week days.
Initial download of the metrics may take a while.