Fig. 5
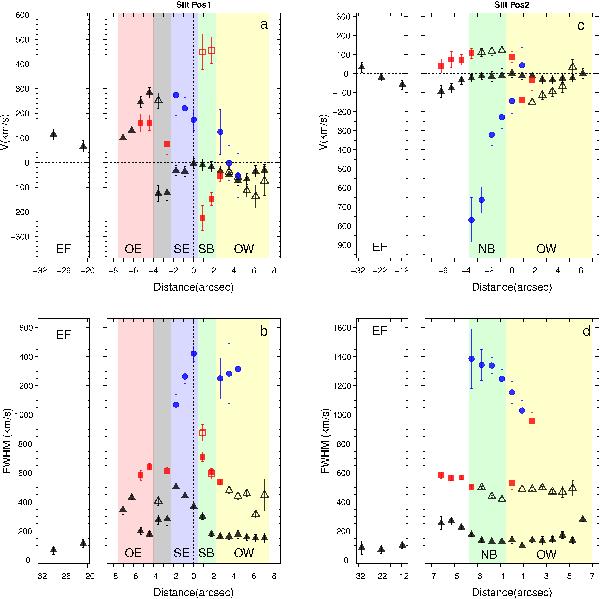
Velocity shifts (ΔV) and widths (FWHM, corrected for instrumental width) plotted against the distance from a reference point in the galaxy, for Slit Pos1 and Pos2 (see the text for details on the selection D = 0 arcsec reference point). Extraction apertures of 2 pixels (i.e. 0.88 arcsec) were used for the figure, except at the very extended regions, where we used the apertures Ap-e and Ap-f for Pos1 and Ap-i, Ap-j and Ap-k for Pos2. Black triangles, red squares and blue circles correspond to the narrow, intermediate and broad components. To help the reader associate the points in the upper panels to those in the lower panels, when more than one kinematic component within the same FWHM range is present at a certain location, the second or third component (typically the broader) is indicated with an open symbol. For example, in Figs. 5a and 5b, the ionised gas emission at D ~ 7 arcsec is modelled using two kinematic components of widths FWHM = 152 ± 25 and FWHM = 456 ± 106, i.e. both within the narrow FWHM range. To be able to unambiguously associate the points in Fig. 5a to those in Fig. 5b at this location, the broader component is plotted with an open triangle. Finally, the shaded regions indicates the location in the galaxy. For Pos1, from west to east: yellow, green, blue and red correspond to Outflow-West (OW), S-Bubble (SB), SE compact structure and Outflow-East (OE) respectively. In addition, the grey-shaded region corresponds to the prominent dust lane observed to the east of the nuclear region. For Pos2, yellow and green correspond to Outflow-West and N-Bubble (NB) respectively. The region corresponding to the extended filaments (EF) is also indicated in the figure. (A color version of this figure is available in the online journal.)
Current usage metrics show cumulative count of Article Views (full-text article views including HTML views, PDF and ePub downloads, according to the available data) and Abstracts Views on Vision4Press platform.
Data correspond to usage on the plateform after 2015. The current usage metrics is available 48-96 hours after online publication and is updated daily on week days.
Initial download of the metrics may take a while.