Fig. 4
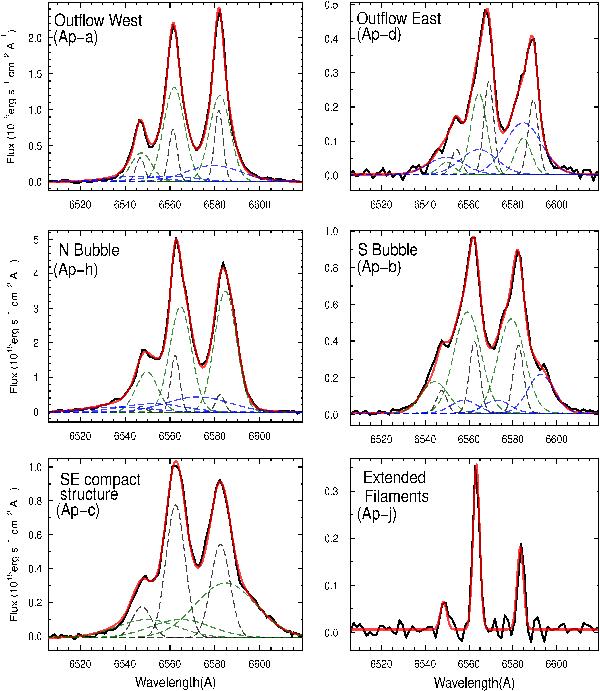
Emission line modelling results for the Hα (λrest = 6563Å) and the [NII] emission lines (λrest = 6548 and 6583Å). The black solid line represents the data, while the red solid line represents the overall fit to the emission lines. Black, green and blue dashed lines correspond to the different kinematic components in order of increasing FWHM. The region of the galaxy corresponding to each of the emission line profiles, and the extraction aperture that samples that region, are also indicated in the figure. (A color version of this figure is available in the online journal.)
Current usage metrics show cumulative count of Article Views (full-text article views including HTML views, PDF and ePub downloads, according to the available data) and Abstracts Views on Vision4Press platform.
Data correspond to usage on the plateform after 2015. The current usage metrics is available 48-96 hours after online publication and is updated daily on week days.
Initial download of the metrics may take a while.