Fig. 3
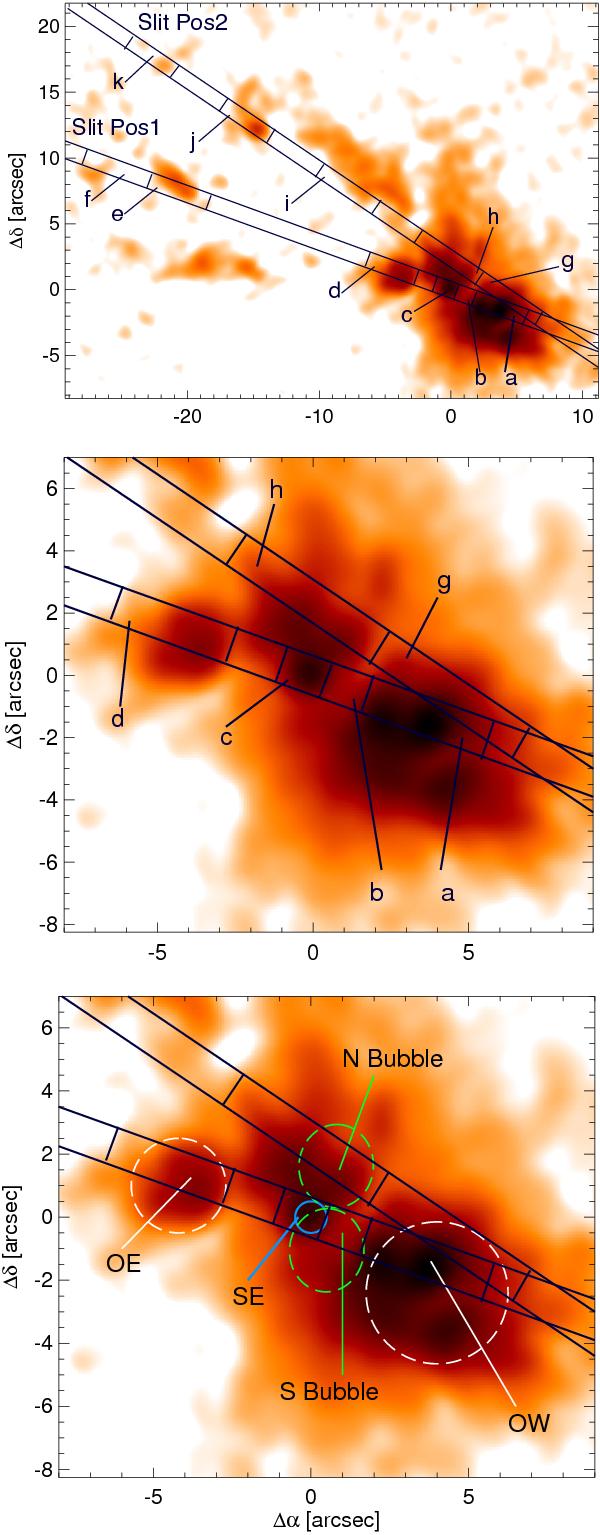
Upper panel: HST continuum subtracted [OIII] image of the galaxy showing the location of the slits and the extraction apertures. The images have been convolved with a Gaussian of FWHM = 1′′ to simulate the seeing conditions during the spectroscopic observations. Middle and lower panels: these two figures are a zoom into the nuclear region of the galaxy. The figures show in detail the main regions of interest that are later analyzed in the paper (see the text for details) and the apertures that cover those regions. (A color version of this figure is available in the online journal).
Current usage metrics show cumulative count of Article Views (full-text article views including HTML views, PDF and ePub downloads, according to the available data) and Abstracts Views on Vision4Press platform.
Data correspond to usage on the plateform after 2015. The current usage metrics is available 48-96 hours after online publication and is updated daily on week days.
Initial download of the metrics may take a while.