Fig. 1
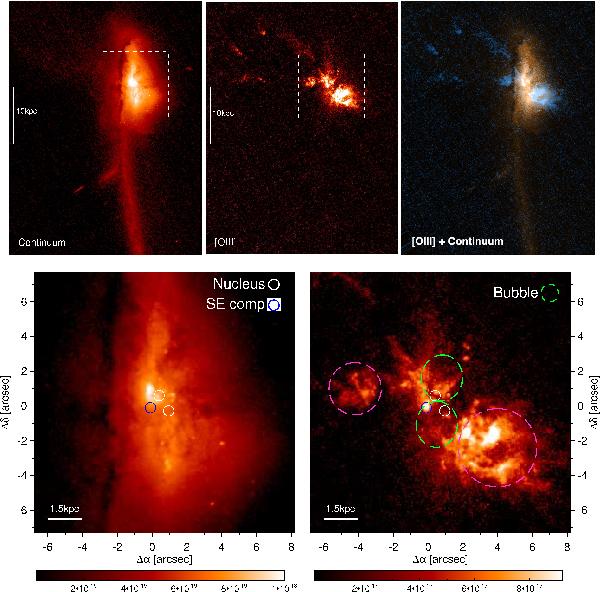
Upper panel, left to right: HST/ACS continuum, continuum subtracted [OIII], and [OIII] (blue)+continuum (red) images of the galaxy. North is up, east is left. The dashed-line boxes indicated the zoomed region in the lower panel. Lower panel: zoom into the central 15×15 arcsec region (11.6×11.6 kpc) for the continuum (upper-left) and the continuum-subtracted [OIII] (upper-middle) images of the galaxy. The color bars at the bottom of the images indicate the flux in units of erg s-1 cm-2 Å-1 and erg s-1 cm-2 for the continuum and the [OIII] images respectively. The white circles indicate the locations of the N and SW nuclear components observed at IR wavelengths, while the blue circle corresponds to the location of the SE component that emerges at radio wavelengths. The green-dashed line ellipses in the continuum subtracted [OIII] image indicate the location of the nuclear superbubble reported by RV13 in their IFS study of the source, while magenta-dashed line circles indicate the location of the so-called Outflow-East and West regions (see text for details). (A color version of this figure is available in the online journal.)
Current usage metrics show cumulative count of Article Views (full-text article views including HTML views, PDF and ePub downloads, according to the available data) and Abstracts Views on Vision4Press platform.
Data correspond to usage on the plateform after 2015. The current usage metrics is available 48-96 hours after online publication and is updated daily on week days.
Initial download of the metrics may take a while.