Fig. 8
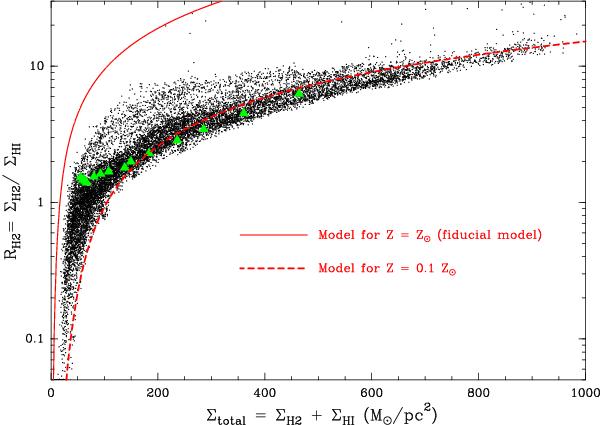
H2-to-H i ratio, RH2, of each map point as a function of the total surface density, ΣH i + ΣH2, compared with the predictions of the Krumholz et al. (2009) model (red curves, taken from their Eq. (39)). The green triangles indicate the mean RH2 values measured within the rings used in Fig. 7. The RH2 ratio values measured throughout the W43 molecular complex and its surroundings are in striking disagreement with the fiducial model of Krumholz et al. (2009).
Current usage metrics show cumulative count of Article Views (full-text article views including HTML views, PDF and ePub downloads, according to the available data) and Abstracts Views on Vision4Press platform.
Data correspond to usage on the plateform after 2015. The current usage metrics is available 48-96 hours after online publication and is updated daily on week days.
Initial download of the metrics may take a while.