Fig. 7
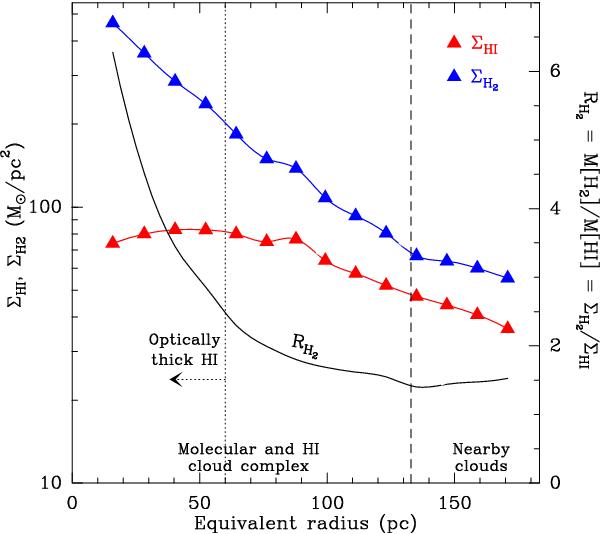
H i and H2 surface densities (red and blue curves plus triangles, respectively) and the H2-to-H i ratio (black curve) measured throughout the W43 atomic/molecular cloud complex and the nearby clouds. Measurements are averaged within rectangular annuli centered at l = 30.5° and b = 0° and with an aspect ratio 3:2. The dashed vertical line outlines the extent of the W43 complex, the dotted vertical line and arrow locate the region inside which the H i line emission is widely optically thick. The H i surface density is significantly higher than the equilibrium models predict, while the H2 density remains high, in disagreement with a clear H i/H2 transition.
Current usage metrics show cumulative count of Article Views (full-text article views including HTML views, PDF and ePub downloads, according to the available data) and Abstracts Views on Vision4Press platform.
Data correspond to usage on the plateform after 2015. The current usage metrics is available 48-96 hours after online publication and is updated daily on week days.
Initial download of the metrics may take a while.