Fig. 6
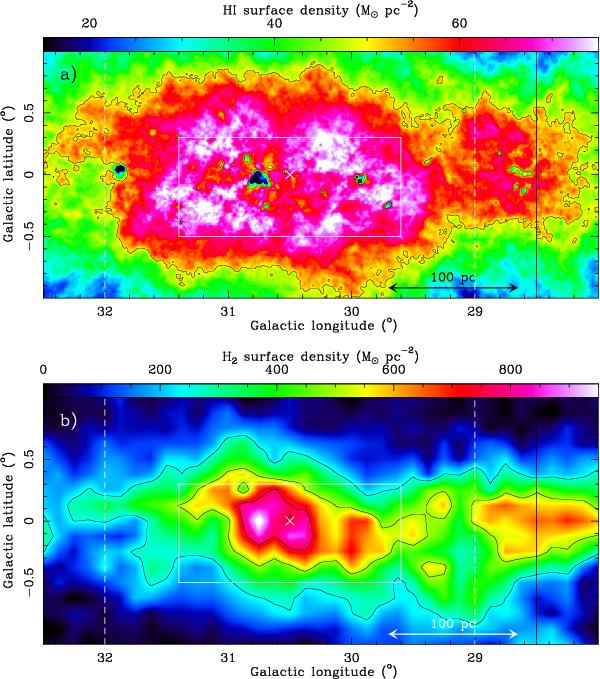
W43 surface density images of H i and H2 gases in a) and b), respectively. They were calculated using H i and 12CO 1–0 lines integrated over 60–120 km s-1 and Eqs. (1) and (3). Contours are 50 M⊙pc-2 in a) and 250, 500, and 750 M⊙pc-2 in b). The white boxes outline the extent of the W43 molecular complex (continuous lines) and its H i envelope (dashed lines) as defined in Nguyen Luong et al. (2011b). The black box locates the largest ring used in the RH2 diagram (see Fig. 7) and the white cross its center.
Current usage metrics show cumulative count of Article Views (full-text article views including HTML views, PDF and ePub downloads, according to the available data) and Abstracts Views on Vision4Press platform.
Data correspond to usage on the plateform after 2015. The current usage metrics is available 48-96 hours after online publication and is updated daily on week days.
Initial download of the metrics may take a while.