Fig. 5
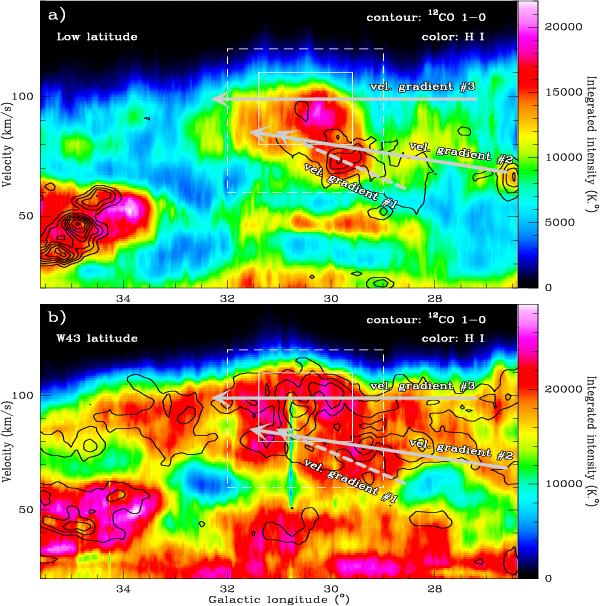
Position-velocity diagrams investigating the 12CO 1–0/H i cloud ensembles #1–#3 identified in Figs. 3, 4 (white arrows, see also Sect. 3.3) at various latitudes. The distributions of the H i (color) and 12CO 1–0 (contours) are plotted against the Galactic longitude, kept as the x axis, as in Fig. 2. The H i and 12CO 1–0 lines have been summed in a) over b = −1.4° to b = −0.7° to highlight negative-latitude cloud ensembles and in b) over the b = −0.5° to b = 0.3° latitude range of the W43 molecular complex. The contours of a) go from 150 to 1200 K with a step of 150 K. Those of b) run from 300 to 1200 K, with a step of 300 K. The white boxes represent the longitude extent and velocity range of the W43 molecular complex (continuous lines) and its H i envelope (dashed lines). The negative-latitude cloud ensemble #1 can easily be identified in a) and the other two cloud ensembles can be seen in b).
Current usage metrics show cumulative count of Article Views (full-text article views including HTML views, PDF and ePub downloads, according to the available data) and Abstracts Views on Vision4Press platform.
Data correspond to usage on the plateform after 2015. The current usage metrics is available 48-96 hours after online publication and is updated daily on week days.
Initial download of the metrics may take a while.