Fig. 4
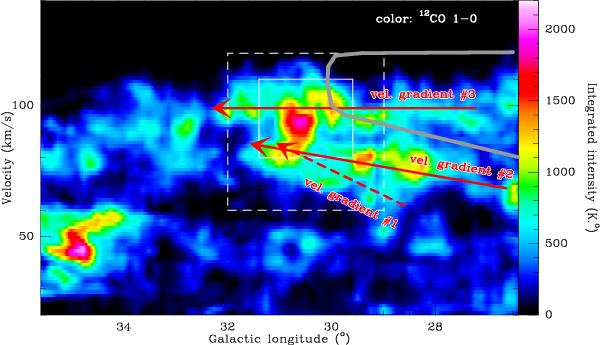
Position-velocity diagram unfolding the two velocity components of W43 into the 12CO 1–0 cloud ensembles #2 and #3 (arrows, see Sect. 3.3). The distributions of 12CO 1–0 (color) are plotted against the Galactic longitude, kept as the x axis, as in Fig. 2. The 12CO 1–0 lines have been summed over the b = −1° to b = 1° latitude range corresponding to the W43 complex and its H i envelope. The white boxes represent the longitude extent and velocity range of the W43 molecular complex (continuous lines) and its H i envelope (dashed lines). The thick gray curve indicates the theoretical location of the Scutum-Centaurus arm in the model by Vallée (2008).
Current usage metrics show cumulative count of Article Views (full-text article views including HTML views, PDF and ePub downloads, according to the available data) and Abstracts Views on Vision4Press platform.
Data correspond to usage on the plateform after 2015. The current usage metrics is available 48-96 hours after online publication and is updated daily on week days.
Initial download of the metrics may take a while.