Fig. 1
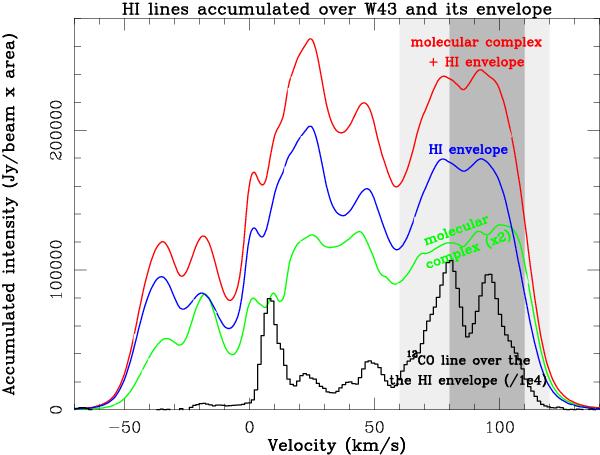
W43 H i lines (curves) delimited well by the 60–120 km s-1 velocity range and displaying a double-peak shape similar to the 12CO 1–0 lines (black histogram). H i spectra result from the sum over all observed beams in the 1.8° × 0.8° area covering the W43 molecular complex (green curve, ×2, within the white rectangle of Fig. 2), those within its H i envelope (blue curve, in between the white continuous and dashed rectangles of Fig. 2) and the 3° × 2° area covering both components (red curve, within the white dashed rectangle of Fig. 2). The main and complete velocity ranges of W43 defined by Nguyen Luong et al. (2011b) are indicated by the light and dark gray shaded regions, respectively.
Current usage metrics show cumulative count of Article Views (full-text article views including HTML views, PDF and ePub downloads, according to the available data) and Abstracts Views on Vision4Press platform.
Data correspond to usage on the plateform after 2015. The current usage metrics is available 48-96 hours after online publication and is updated daily on week days.
Initial download of the metrics may take a while.