Fig. 7
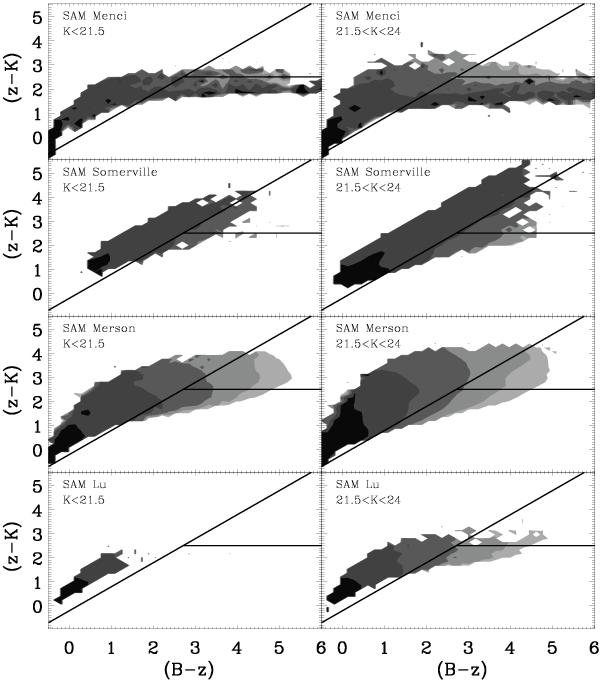
B − z versus z − K color–color diagram for model galaxies in two bins of K-magnitude. The filled contours correspond to the predicted average values of the specific star-formation rate of model galaxies for bins of different B-z and z − K. The SSFR values are equally spaced on logarithmic scale from SSFR = 10-13 yr-1 for the lightest filled region to SSFR = 10-9 yr-1 for the darkest.
Current usage metrics show cumulative count of Article Views (full-text article views including HTML views, PDF and ePub downloads, according to the available data) and Abstracts Views on Vision4Press platform.
Data correspond to usage on the plateform after 2015. The current usage metrics is available 48-96 hours after online publication and is updated daily on week days.
Initial download of the metrics may take a while.