Fig. 6
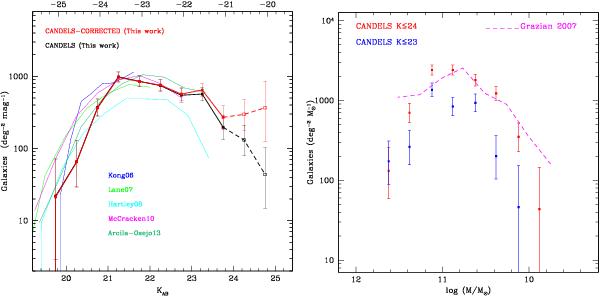
Left: number counts of the CANDELS (UDS+GOODS-S) pBzK galaxies as a function of the observed K magnitude. The black points and line show the raw data, while the red points and line show the data after correcting for incompleteness as discussed in the text. The upper x-axis shows the corresponding rest-frame absolute magnitude in the I band at z ≃ 2.As highlighted in the text, the corrections for incompleteness are below a factor 2 at most up to K ≃ 24, which sets the limit for a rigorous analysis. However, we plot the faint end of the distribution until K< 25 with a dotted line for reference. The blue, green, cyan, magenta, and darkgreen lines show the number counts for pBzK galaxies from Kong et al. (2006), Lane et al. (2007), Hartley et al. (2008), McCracken et al. (2010), and Arcila-Osejo et al. (2013), respectively. Right: the stellar mass distribution of the CANDELS pBzK galaxies, after correction for incompleteness and contamination as described in the text. Masses are obtained with the multiband SED-fitting technique. Blue points are obtained from the K< 23 sample, where all galaxies are at z< 2.5, while the red points are from the K< 24 sample, which includes objects up to z ≃ 3.5. For comparison we also plot the galaxy stellar mass distribution of the pBzK derived by Grazian et al. (2007) from the GOODS-MUSIC sample (magenta dashed line).
Current usage metrics show cumulative count of Article Views (full-text article views including HTML views, PDF and ePub downloads, according to the available data) and Abstracts Views on Vision4Press platform.
Data correspond to usage on the plateform after 2015. The current usage metrics is available 48-96 hours after online publication and is updated daily on week days.
Initial download of the metrics may take a while.