Fig. 4
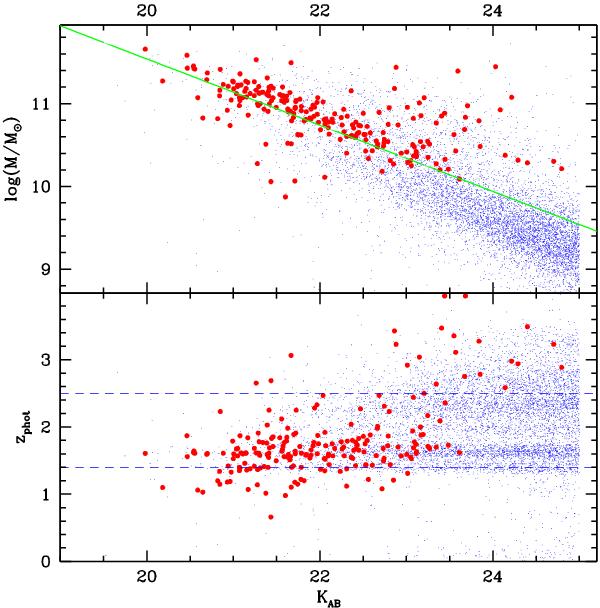
Distribution of photometric redshift and stellar masses (upper panel) as a function of the K magnitude for the whole BzK sample. Blue small points refer to sBzK galaxies, red dots to pBzK. In the lower panel the two dashed lines represent the nominal redshift range of the BzK distribution; in the upper panel, the green thick line represents the average M⊙ − K relation of Daddi et al. (2004).
Current usage metrics show cumulative count of Article Views (full-text article views including HTML views, PDF and ePub downloads, according to the available data) and Abstracts Views on Vision4Press platform.
Data correspond to usage on the plateform after 2015. The current usage metrics is available 48-96 hours after online publication and is updated daily on week days.
Initial download of the metrics may take a while.