Fig. 2
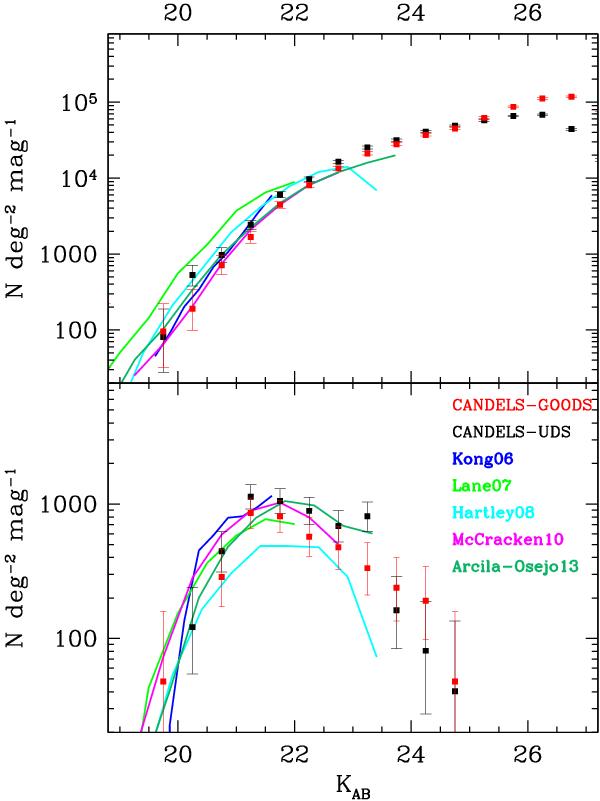
Number counts for the sBzK (upper panel) and pBzK (bottom panel) galaxies in the two CANDELS fields plotted separately, red GOODS-S and black UDS. We assume Poissonian error bars, computed with the Gehrels (1986) formula for low number counts. Previous results from the literature are overplotted: Kong et al. (2006) in blue, Lane et al. (2007) in green, Hartley et al. (2008) in cyan, McCracken et al. (2010) in magenta, and Arcila-Osejo et al. (2013) in dark green.
Current usage metrics show cumulative count of Article Views (full-text article views including HTML views, PDF and ePub downloads, according to the available data) and Abstracts Views on Vision4Press platform.
Data correspond to usage on the plateform after 2015. The current usage metrics is available 48-96 hours after online publication and is updated daily on week days.
Initial download of the metrics may take a while.