Fig. 8
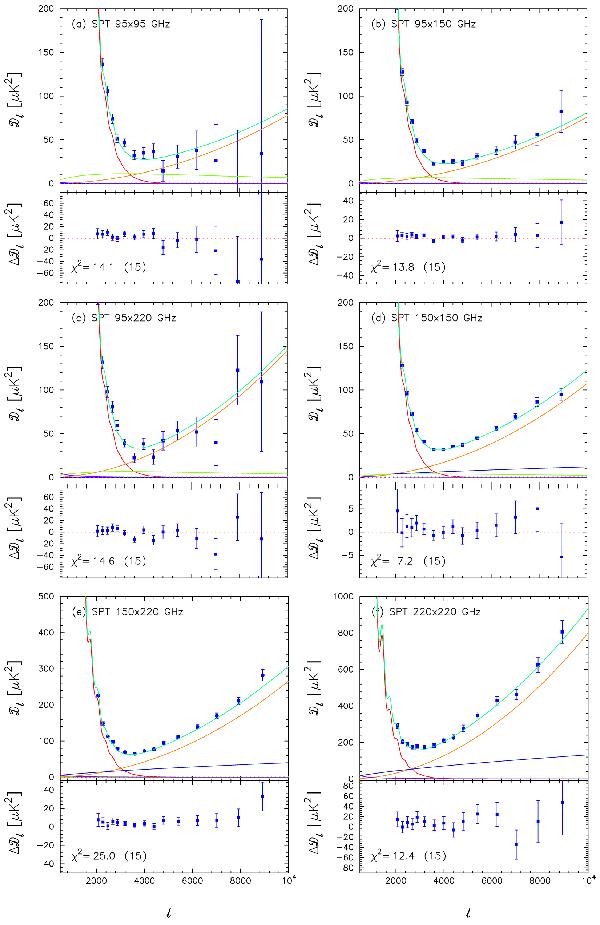
SPT power spectra at high multipoles using the foreground model developed in this paper. The SPT R12 power spectra for each frequency combination are shown by the blue points, together with 1σ error bars. The foreground components, determined from the Planck+WP+highL analysis of ΛCDM models, are shown in the upper panels using the same colour coding as in Fig. 7. Here, the spectrum of the best-fit CMB is shown in red and the total spectra are the upper green curves. The lower panel in each sub-figure shows the residuals with respect to the best-fit base ΛCDM cosmology+foreground model. The χ2 values of the residuals, and the number of SPT bandpowers, are listed in the lower panels.
Current usage metrics show cumulative count of Article Views (full-text article views including HTML views, PDF and ePub downloads, according to the available data) and Abstracts Views on Vision4Press platform.
Data correspond to usage on the plateform after 2015. The current usage metrics is available 48-96 hours after online publication and is updated daily on week days.
Initial download of the metrics may take a while.