Fig. 7
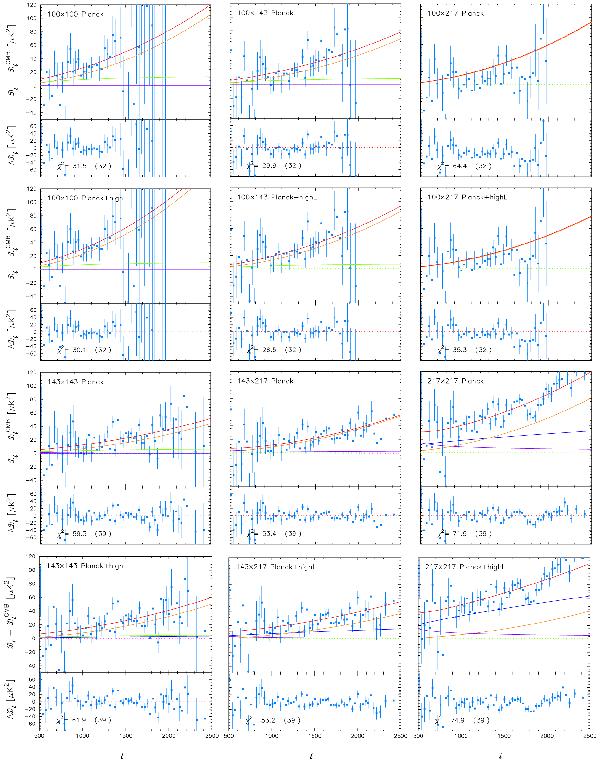
Power spectrum residual plots illustrating the accuracy of the foreground modelling. For each cross-spectrum, there are two sub-figures. The upper sub-figures show the residuals with respect to the Planck+WP best-fit solution (from Table 5). The lowers sub-figure show the residuals with respect to the Planck+WP+highL solution The upper panel in each sub-figure shows the residual between the measured power spectrum and the best-fit (lensed) CMB power spectrum. The lower panels show the residuals after further removing the best-fit foreground model. The lines in the upper panels show the various foreground components. Major foreground components are shown by the solid lines, colour coded as follows: total foreground spectrum (red); Poisson point sources (orange); clustered CIB (blue); thermal SZ (green); and Galactic dust (purple). Minor foreground components are shown by the dotted lines colour coded as follows: kinetic SZ (green); tSZ×CIB cross-correlation (purple). We also show residuals for the two spectra 100 × 143 and 100 × 217 that are not used in the Planck likelihood. For these, we have assumed Poisson point-source correlation coefficients of unity.The χ2 values of the residuals, and the number of bandpowers, are listed in the lower panels.
Current usage metrics show cumulative count of Article Views (full-text article views including HTML views, PDF and ePub downloads, according to the available data) and Abstracts Views on Vision4Press platform.
Data correspond to usage on the plateform after 2015. The current usage metrics is available 48-96 hours after online publication and is updated daily on week days.
Initial download of the metrics may take a while.