Fig. B.2
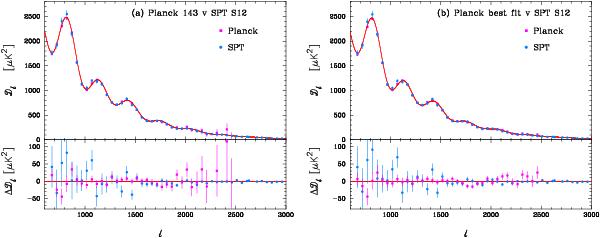
Fits to the joint likelihoods for Planck and SPT S12 spectra. a) Fits using only the 143 × 143 GHz spectrum in the Planck likelihood. The blue points show the SPT data after recalibration and foreground subtraction, using the best-fit solution from the joint likelihood analysis. The magenta points show the foreground-subtracted Planck143 × 143 GHz spectrum. The lower panel shows the residuals with respect to the best-fit ΛCDM model to the Planck+SPT combined likelihoods (shown by the red line in the top panel). b) Foreground-subtracted and recalibrated SPT spectra using the best-fit parameters from the likelihood analysis of the full Planck likelihood combined with the SPT S12 likelihood. The magenta points show the best-fit PlanckΛCDM spectrum from Fig. 10 and the red line shows the best-fit Planck+WP+highL base ΛCDM model from the full Planck likelihood. The residuals with respect to this model are plotted in the lower panel.
Current usage metrics show cumulative count of Article Views (full-text article views including HTML views, PDF and ePub downloads, according to the available data) and Abstracts Views on Vision4Press platform.
Data correspond to usage on the plateform after 2015. The current usage metrics is available 48-96 hours after online publication and is updated daily on week days.
Initial download of the metrics may take a while.