Free Access
Fig. A.2
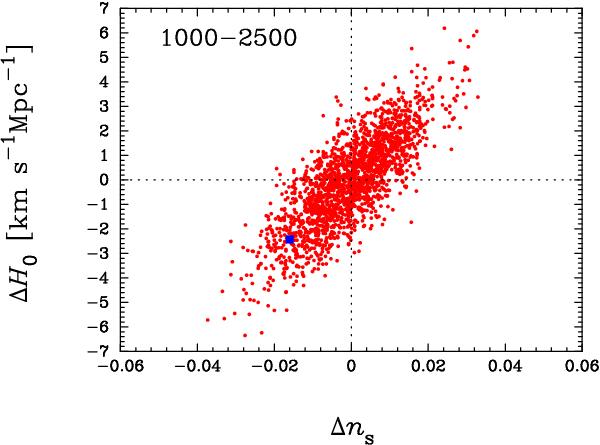
Variations in H0 and ns as the maximum multipole in the Planck likelihood is increased from ℓmax = 1000 to 2500. The red points show the changes in parameters determined from 2000 simulations, as described in the text. The blue point shows the changes determined from the real data.
Current usage metrics show cumulative count of Article Views (full-text article views including HTML views, PDF and ePub downloads, according to the available data) and Abstracts Views on Vision4Press platform.
Data correspond to usage on the plateform after 2015. The current usage metrics is available 48-96 hours after online publication and is updated daily on week days.
Initial download of the metrics may take a while.