Fig. A.1
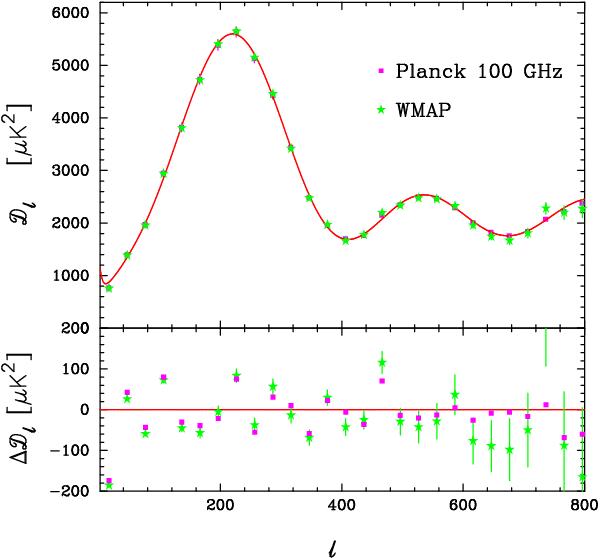
Comparison of the Planck and WMAP-9 power spectra. The green points show the combined WMAP-9 V+W-band spectrum computed on the same mask used for the 100 × 100 GHz Planck spectrum (with a combined WMAP+Planck mask for point sources) after rescaling the WMAP power spectrum by a multiplicative factor of 0.974. The magenta points show the Planck100 × 100 GHz spectrum computed on the same mask. The red line shows the best-fit Planck+WP+highL base ΛCDM model. The lower panel shows the residuals with respect to this model. The error bars on the WMAP points show the instrumental noise together with the noise-signal errors as discussed in the text; errors are not shown for Planck.
Current usage metrics show cumulative count of Article Views (full-text article views including HTML views, PDF and ePub downloads, according to the available data) and Abstracts Views on Vision4Press platform.
Data correspond to usage on the plateform after 2015. The current usage metrics is available 48-96 hours after online publication and is updated daily on week days.
Initial download of the metrics may take a while.