Fig. 32
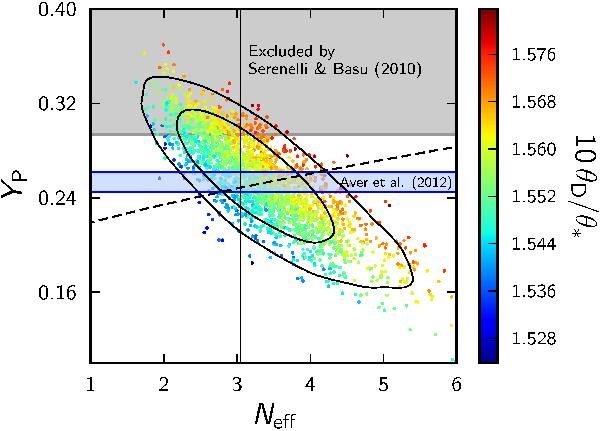
2D joint posterior distribution for Neff and YP with both parameters varying freely, determined from Planck+WP+highL data. Samples are colour-coded by the value of the angular ratio θD/θ∗, which is constant along the degeneracy direction. The Neff-YP relation from BBN theory is shown by the dashed curve. The vertical line shows the standard value Neff = 3.046. The region with YP> 0.294 is highlighted in grey, delineating the region that exceeds the 2σ upper limit of the recent measurement of initial Solar helium abundance (Serenelli & Basu 2010), and the blue horizontal region is the 68% confidence region from the Aver et al. (2012) compilation of 4He measurements.
Current usage metrics show cumulative count of Article Views (full-text article views including HTML views, PDF and ePub downloads, according to the available data) and Abstracts Views on Vision4Press platform.
Data correspond to usage on the plateform after 2015. The current usage metrics is available 48-96 hours after online publication and is updated daily on week days.
Initial download of the metrics may take a while.