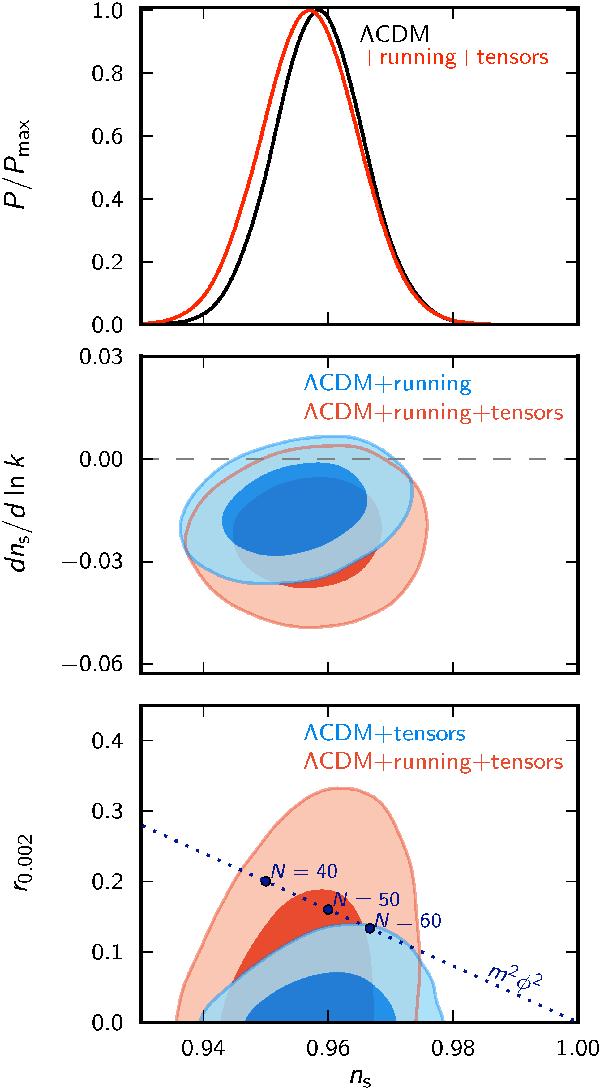
Fig. 23
Upper: posterior distribution for ns for the base ΛCDM model (black) compared to the posterior when a tensor component and running scalar spectral index are added to the model (red) Middle: constraints (68% and 95%) in the ns–dns/ dlnk plane for ΛCDM models with running (blue) and additionally with tensors (red). Lower: constraints (68% and 95%) on ns and the tensor-to-scalar ratio r0.002 for ΛCDM models with tensors (blue) and additionally with running of the spectral index (red). The dotted line show the expected relation between r and ns for a V(φ) ∝ φ2 inflationary potential (Eqs. (65a) and (65b)); here N is the number of inflationary e-foldings as defined in the text. The dotted line should be compared to the blue contours, since this model predicts negligible running. All of these results use the Planck+WP+highL data combination.
Current usage metrics show cumulative count of Article Views (full-text article views including HTML views, PDF and ePub downloads, according to the available data) and Abstracts Views on Vision4Press platform.
Data correspond to usage on the plateform after 2015. The current usage metrics is available 48-96 hours after online publication and is updated daily on week days.
Initial download of the metrics may take a while.