Free Access
Fig. 22
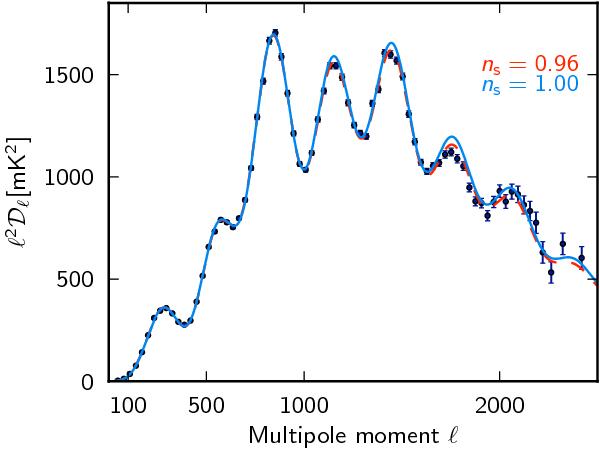
Planck power spectrum of Fig. 10 plotted as ![]() against multipole, compared to the best-fit base ΛCDM model with ns = 0.96 (red dashed line). The best-fit base ΛCDM model with ns constrained to unity is shown by the blue line.
against multipole, compared to the best-fit base ΛCDM model with ns = 0.96 (red dashed line). The best-fit base ΛCDM model with ns constrained to unity is shown by the blue line.
Current usage metrics show cumulative count of Article Views (full-text article views including HTML views, PDF and ePub downloads, according to the available data) and Abstracts Views on Vision4Press platform.
Data correspond to usage on the plateform after 2015. The current usage metrics is available 48-96 hours after online publication and is updated daily on week days.
Initial download of the metrics may take a while.