Fig. 18
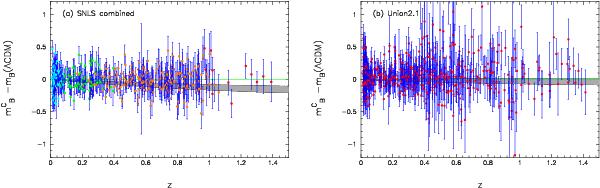
Magnitude residuals relative to the base ΛCDM model that best fits the SNLS combined sample (left) and the Union2.1 sample (right). The error bars show the 1σ (diagonal) errors on mB. The filled grey regions show the residuals between the expected magnitudes and the best-fit to the SNe sample as Ωm varies across the ± 2σ range allowed by Planck+WP+highL in the base ΛCDM cosmology. The colour coding of the SNLS samples are as follows: low redshift (blue points); SDSS (green points); SNLS three-year sample (orange points); and HST high redshift (red points).
Current usage metrics show cumulative count of Article Views (full-text article views including HTML views, PDF and ePub downloads, according to the available data) and Abstracts Views on Vision4Press platform.
Data correspond to usage on the plateform after 2015. The current usage metrics is available 48-96 hours after online publication and is updated daily on week days.
Initial download of the metrics may take a while.