Free Access
Fig. 17
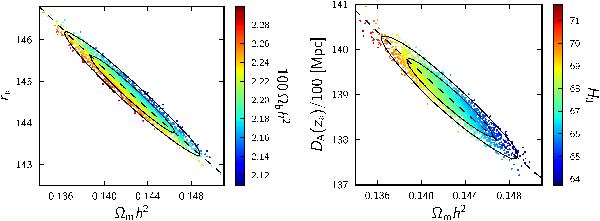
MCMC samples and contours in the r∗-Ωmh2 plane (left) and the DA(z∗)-Ωmh2 plane (right) for ΛCDM models analysed with Planck+WP+highL. The lines in these plots show the expected degeneracy directions in the base ΛCDM cosmology. Samples are colour-coded by the values of Ωbh2 (left) and H0 (right).
This figure is made of several images, please see below:
Current usage metrics show cumulative count of Article Views (full-text article views including HTML views, PDF and ePub downloads, according to the available data) and Abstracts Views on Vision4Press platform.
Data correspond to usage on the plateform after 2015. The current usage metrics is available 48-96 hours after online publication and is updated daily on week days.
Initial download of the metrics may take a while.