Fig. 14
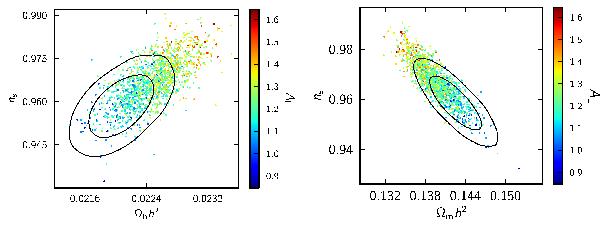
Effect of allowing AL to vary on the degeneracies between Ωbh2 and ns (left) and Ωmh2 and ns (right). In both panels the data combination is Planck+WP+highL. The contours enclose the 68% and 95% confidence regions in the base ΛCDM model with AL = 1. The samples are from models with variable AL and are colour-coded by the value of AL.
Current usage metrics show cumulative count of Article Views (full-text article views including HTML views, PDF and ePub downloads, according to the available data) and Abstracts Views on Vision4Press platform.
Data correspond to usage on the plateform after 2015. The current usage metrics is available 48-96 hours after online publication and is updated daily on week days.
Initial download of the metrics may take a while.