Fig. 12
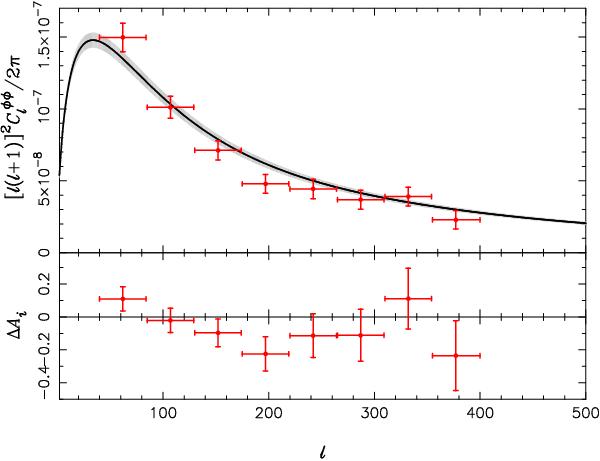
Planck measurements of the lensing power spectrum compared to the prediction for the best-fitting Planck+WP+highL ΛCDM model parameters. In the top panel, the data points are the measured bandpowers and ± 1σ error ranges from the diagonal of the covariance matrix. The measured bandpowers are compared to the ![]() in the best-fit model (black line). The grey region shows the 1σ range in
in the best-fit model (black line). The grey region shows the 1σ range in ![]() due to ΛCDM parameter uncertainties. The lower panel shows the differences between the bandpower amplitudes Âi and the predictions for their expectation values in the best-fit model,
due to ΛCDM parameter uncertainties. The lower panel shows the differences between the bandpower amplitudes Âi and the predictions for their expectation values in the best-fit model, ![]() .
.
Current usage metrics show cumulative count of Article Views (full-text article views including HTML views, PDF and ePub downloads, according to the available data) and Abstracts Views on Vision4Press platform.
Data correspond to usage on the plateform after 2015. The current usage metrics is available 48-96 hours after online publication and is updated daily on week days.
Initial download of the metrics may take a while.