Fig. 10
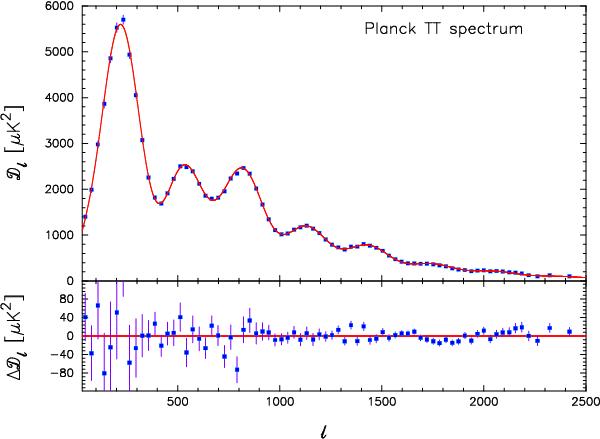
PlanckTT power spectrum. The points in the upper panel show the maximum-likelihood estimates of the primary CMB spectrum computed as described in the text for the best-fit foreground and nuisance parameters of the Planck+WP+highL fit listed in Table 5. The red line shows the best-fit base ΛCDM spectrum. The lower panel shows the residuals with respect to the theoretical model. The error bars are computed from the full covariance matrix, appropriately weighted across each band (see Eqs. (36a) and (36b)) and include beam uncertainties and uncertainties in the foreground model parameters.
Current usage metrics show cumulative count of Article Views (full-text article views including HTML views, PDF and ePub downloads, according to the available data) and Abstracts Views on Vision4Press platform.
Data correspond to usage on the plateform after 2015. The current usage metrics is available 48-96 hours after online publication and is updated daily on week days.
Initial download of the metrics may take a while.