Fig. 1
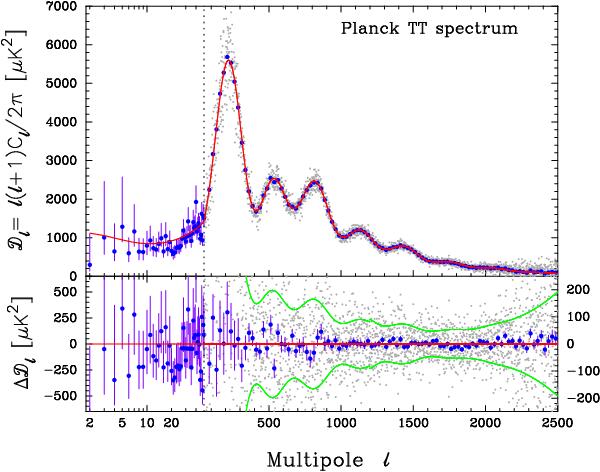
Planck foreground-subtracted temperature power spectrum (with foreground and other “nuisance” parameters fixed to their best-fit values for the base ΛCDM model). The power spectrum at low multipoles (ℓ = 2–49, plotted on a logarithmic multipole scale) is determined by the Commander algorithm applied to the Planck maps in the frequency range 30–353 GHz over 91% of the sky. This is used to construct a low-multipole temperature likelihood using a Blackwell-Rao estimator, as described in Planck Collaboration XV (2014). The asymmetric error bars show 68% confidence limits and include the contribution from uncertainties in foreground subtraction. At multipoles 50 ≤ ℓ ≤ 2500 (plotted on a linear multipole scale) we show the best-fit The CMB spectrum computed from the CamSpec likelihood (see Planck Collaboration XV 2014) after removal of unresolved foreground components.This spectrum is averaged over the frequency range 100–217 GHz using frequency-dependent diffuse sky cuts (retaining 58% of the sky at 100 GHz and 37% of the sky at 143 and 217 GHz) and is sample-variance limited to ℓ ~ 1600. The light grey points show the power spectrum multipole-by-multipole. The blue points show averages in bands of width Δℓ = 25 together with 1σ errors computed from the diagonal components of the band-averaged covariance matrix (which includes contributions from beam and foreground uncertainties). The red line shows the temperature spectrum for the best-fit base ΛCDM cosmology. The lower panel shows the power spectrum residuals with respect to this theoretical model. The green lines show the ± 1σ errors on the individual power spectrum estimates at high multipoles computed from the CamSpec covariance matrix. Note the change in vertical scale in the lower panel at ℓ = 50.
Current usage metrics show cumulative count of Article Views (full-text article views including HTML views, PDF and ePub downloads, according to the available data) and Abstracts Views on Vision4Press platform.
Data correspond to usage on the plateform after 2015. The current usage metrics is available 48-96 hours after online publication and is updated daily on week days.
Initial download of the metrics may take a while.