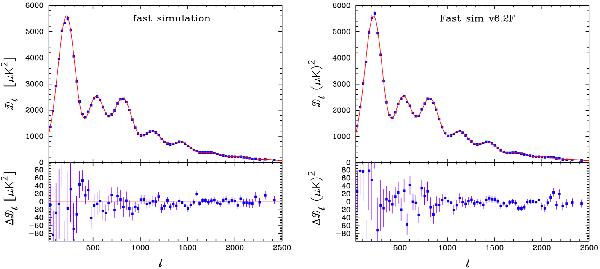
Fig. A.1

Toy power spectra drawn from a Gaussian distribution with mean given by a ΛCDM power spectrum and a covariance given by the band-averaged Cℓ covariance matrix, (top), and the corresponding differences with respect to the input ΛCDM model. Note the apparent presence of “coherent oscillatory features” in the difference spectra. These are fully described by the power spectrum covariance matrix. To assess the statistical significance of apparently “unexpected features” in the power spectrum, it is critical to include all sources of correlations among different Cℓ’s.
Current usage metrics show cumulative count of Article Views (full-text article views including HTML views, PDF and ePub downloads, according to the available data) and Abstracts Views on Vision4Press platform.
Data correspond to usage on the plateform after 2015. The current usage metrics is available 48-96 hours after online publication and is updated daily on week days.
Initial download of the metrics may take a while.


