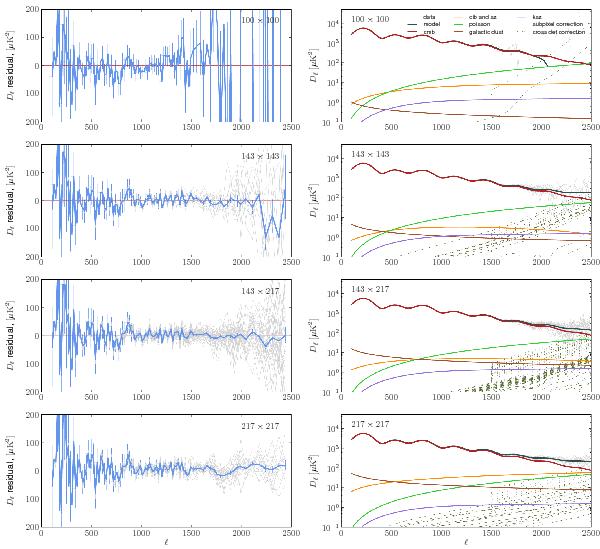
Fig. 17

Left: residuals between the Planck power spectrum derived with Plik using “validation” settings (described in the text) and the Plik best-fit model. The light grey lines show residuals for individual detector pairs within each frequency combination. The blue lines show the inverse covariance weighted averages of the individual residuals, together with their errors computed from the covariance matrix. Right: decomposition of the total best-fitting model power spectra into CMB, combined thermal SZ and CIB, unresolved point sources, kinetic SZ, and Galactic dust.
Current usage metrics show cumulative count of Article Views (full-text article views including HTML views, PDF and ePub downloads, according to the available data) and Abstracts Views on Vision4Press platform.
Data correspond to usage on the plateform after 2015. The current usage metrics is available 48-96 hours after online publication and is updated daily on week days.
Initial download of the metrics may take a while.


