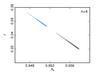
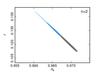
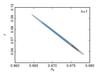
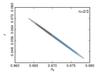
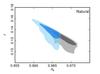
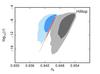
Fig. 8
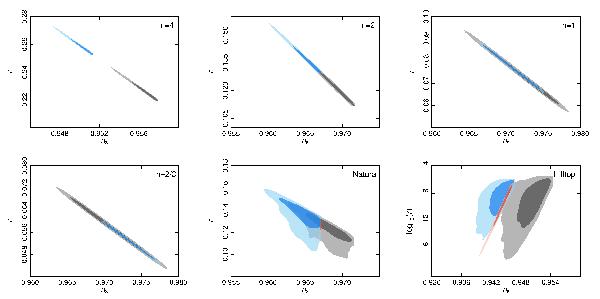
Constraints on ns vs. r at k∗ = 0.002 Mpc-1 for the inflationary models considered (i.e., power law potentials with n = 2 / 3,1,2, and 4, natural inflation, and hilltop inflation), showing joint 68% and 95% CL. Blue and grey distributions correspond to the restrictive and permissive entropy generation scenarios, respectively. The instantaneous entropy generation case corresponds to the thin (red) contours in the natural and hilltop panels; for the single parameter models, this case corresponds to the lowest-r extremity of the restrictive case. The difference between the natural inflation region in Fig. 1 and the natural inflation constraints shown here is due to the strong projection effect described in the text.
Current usage metrics show cumulative count of Article Views (full-text article views including HTML views, PDF and ePub downloads, according to the available data) and Abstracts Views on Vision4Press platform.
Data correspond to usage on the plateform after 2015. The current usage metrics is available 48-96 hours after online publication and is updated daily on week days.
Initial download of the metrics may take a while.