Fig. 24
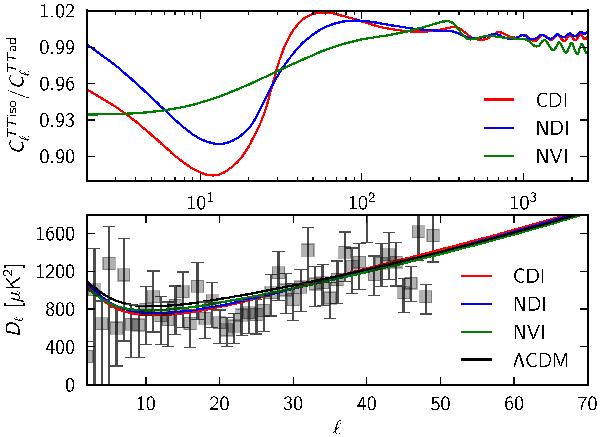
Temperature spectrum of best fit models with a mixture of adiabatic and isocurvature modes. Top: spectrum of the best fit mixed models relative to that of the pure adiabatic model. Bottom: zoom of the Sachs-Wolfe plateau of the best fit temperature spectrum ![]() for each of the three cases plus the pure adiabatic model, shown together with Planck low-ℓ data points.
for each of the three cases plus the pure adiabatic model, shown together with Planck low-ℓ data points.
Current usage metrics show cumulative count of Article Views (full-text article views including HTML views, PDF and ePub downloads, according to the available data) and Abstracts Views on Vision4Press platform.
Data correspond to usage on the plateform after 2015. The current usage metrics is available 48-96 hours after online publication and is updated daily on week days.
Initial download of the metrics may take a while.