Fig. 18
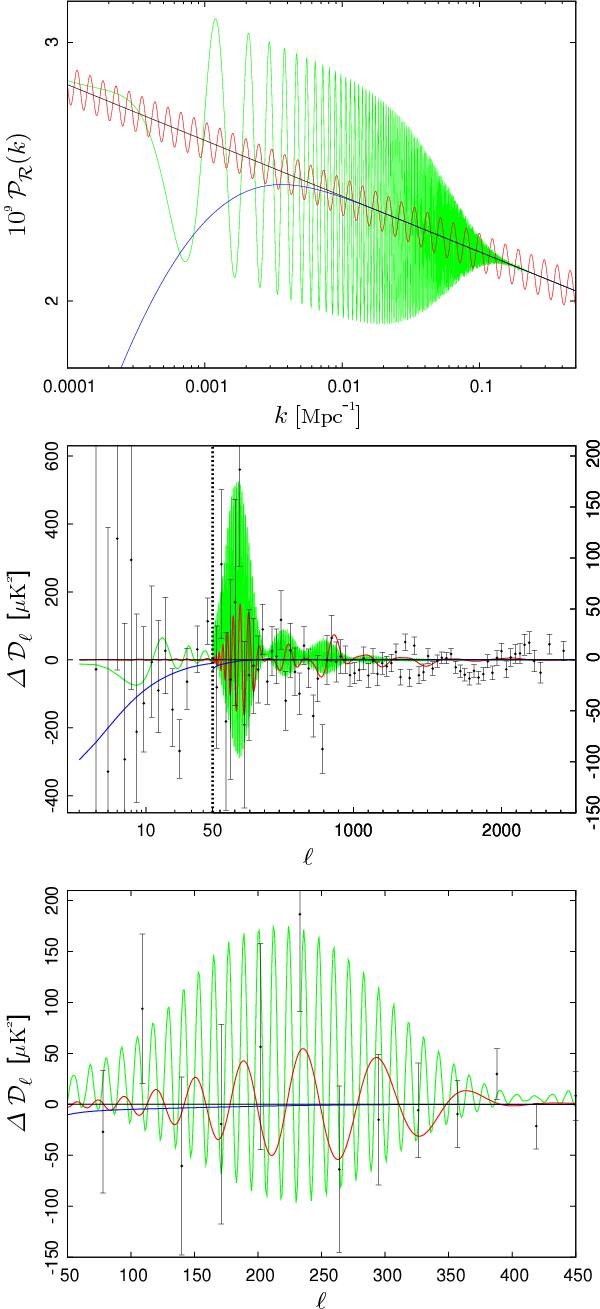
Top: best fit primordial spectrum of curvature perturbations for the power law (black), wiggles (red), step inflation (green), and cutoff (blue) models. Centre: residuals of the temperature angular power spectrum. Note that the scale of the vertical axis changes at ℓ = 50. Bottom: zoom of region around the first acoustic peak.
Current usage metrics show cumulative count of Article Views (full-text article views including HTML views, PDF and ePub downloads, according to the available data) and Abstracts Views on Vision4Press platform.
Data correspond to usage on the plateform after 2015. The current usage metrics is available 48-96 hours after online publication and is updated daily on week days.
Initial download of the metrics may take a while.