Fig. 15
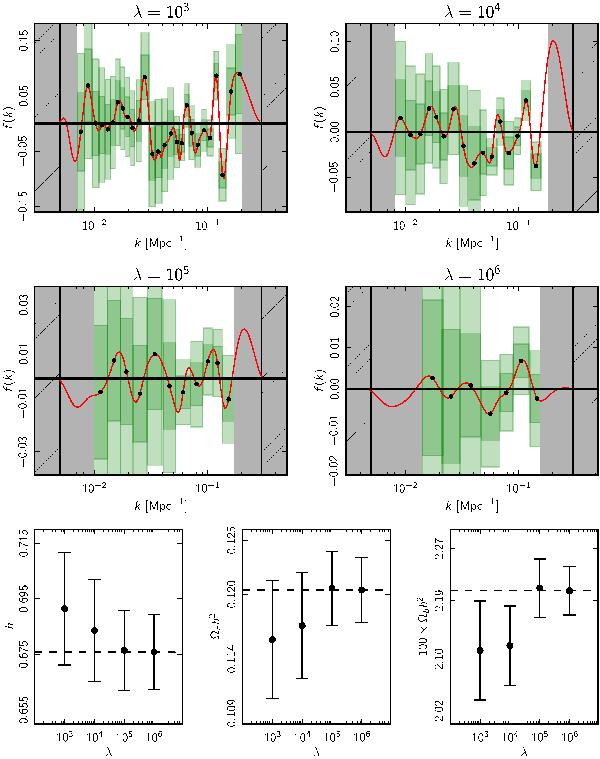
Planck primordial power spectrum feature search results. Top four panels: the reconstructed power spectrum at four values for the smoothing parameter λ. The red curves indicate the maximum likelihood configuration for the fractional deviation f(k) of the power spectrum relative to a power law fiducial model (with As = 2.20 × 10⁻⁹ and ns = 0.9603) for the penalized likelihood. The error bars have a width corresponding to the minimum reconstructible width (the minimum width for a Gaussian feature so that the mean square deviation of the expectation value of the reconstruction differs by less than 10%) and a vertical extent showing the 1σ and 2σ limits for the fractional deviation averaged over the box. The grey hashed regions at the far left and right show where the fixing prior (i.e., α) sets f(k) = 0. The inner grey regions show where the reconstruction bias is so great that the minimum reconstructible width is undefined. Mock features in this region produce reverberations over the entire interval. With λ = 103 and λ = 104, we find statistically significant fluctuations around k ~ 0.1 Mpc-1. Lower panels: the 1σ error bars for three combinations of cosmological parameters at the four values of λ. The maximum likelihood value for the fiducial model is indicated by the dashed line for comparison.
Current usage metrics show cumulative count of Article Views (full-text article views including HTML views, PDF and ePub downloads, according to the available data) and Abstracts Views on Vision4Press platform.
Data correspond to usage on the plateform after 2015. The current usage metrics is available 48-96 hours after online publication and is updated daily on week days.
Initial download of the metrics may take a while.