Fig. 8
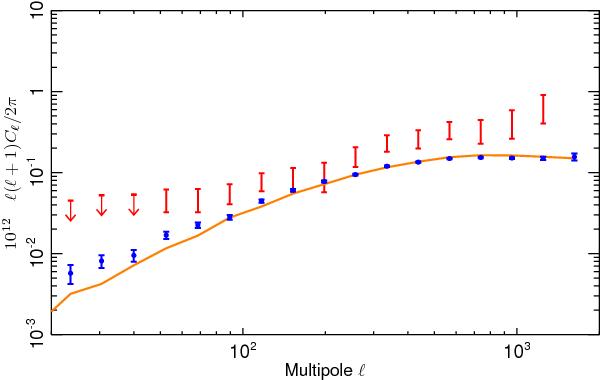
Comparison of the tSZ angular power spectrum estimated from the cross-power-spectrum of the NILC F/L maps (black) with the expected angular power spectrum of the confirmed clusters in the Planck Cluster Sample (orange line). In red we plot the NILC F/L cross-power spectrum after masking these clusters. The green points correspond to the difference of these two cross-power spectra. The cross-power spectrum between the NILC Compton parameter map and the simulated detected cluster map is shown in blue.
Current usage metrics show cumulative count of Article Views (full-text article views including HTML views, PDF and ePub downloads, according to the available data) and Abstracts Views on Vision4Press platform.
Data correspond to usage on the plateform after 2015. The current usage metrics is available 48-96 hours after online publication and is updated daily on week days.
Initial download of the metrics may take a while.