Fig. 4
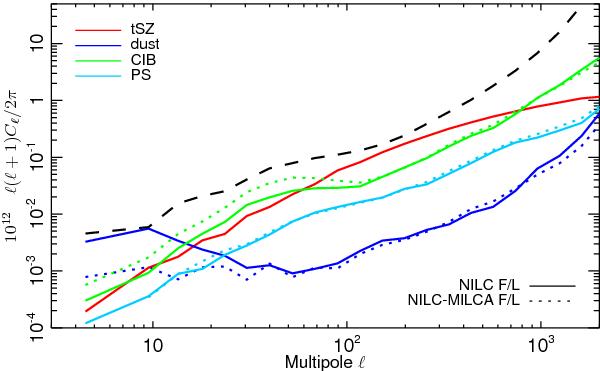
Angular power spectrum of the main foreground contributions as estimated using the FFP6 simulations. We plot the diffuse Galactic emission (blue), clustered CIB (green) and point source (cyan) contributions, as well as the tSZ signal (red). The solid and dotted lines correspond to the NILC F/L and to the NILC-MILCA F/L cross-power spectra, respectively. For illustration we also show the Planck instrumental noise auto-power spectrum (dashed black line) in the MILCA Compton parameter map.
Current usage metrics show cumulative count of Article Views (full-text article views including HTML views, PDF and ePub downloads, according to the available data) and Abstracts Views on Vision4Press platform.
Data correspond to usage on the plateform after 2015. The current usage metrics is available 48-96 hours after online publication and is updated daily on week days.
Initial download of the metrics may take a while.