Fig. 16
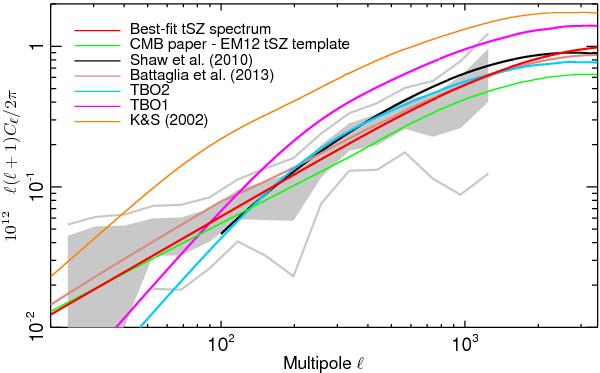
Comparison of the Planck tSZ power spectrum and best-fit model with existing models in the literature. The Planck tSZ power spectrum and the ± 1 and 2σ error bars are shown in grey. We also show the Planck tSZ power spectrum best-fit models derived in this paper (red) and from the analysis of cluster number counts (Planck Collaboration XX 2014, blue). The tSZ power spectrum template used in the CMB cosmological analysis (Planck Collaboration XV 2014; Planck Collaboration XVI 2014, green) is also shown. We additionally show the tSZ power spectrum models from hydrodynamic simulations (Battaglia et al. 2012, brown), from N-body simulations plus semi-analytical dust gas models (Trac et al. 2011, cyan; TBO1 and purple; TBO2), and from analytical calculations (Shaw et al. 2010, black; Komatsu & Seljak 2002, orange).
Current usage metrics show cumulative count of Article Views (full-text article views including HTML views, PDF and ePub downloads, according to the available data) and Abstracts Views on Vision4Press platform.
Data correspond to usage on the plateform after 2015. The current usage metrics is available 48-96 hours after online publication and is updated daily on week days.
Initial download of the metrics may take a while.