Fig. 15
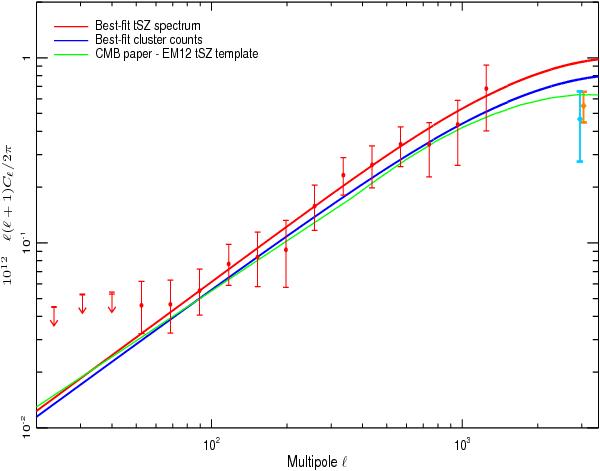
Marginalized bandpowers of the Planck tSZ power spectrum with total (statistical plus foreground) uncertainties (red points). The red solid line represents the best-fit tSZ power spectrum model. We also show as a blue solid line the best-ft tSZ power spectrum obtained from the analysis of cluster number counts (Planck Collaboration XX 2014). The tSZ power spectrum template used in the CMB cosmological analysis (Planck Collaboration XV 2014; Planck Collaboration XVI 2014) is presented as a green solid line. For comparison, we also show the SPT (Reichardt et al. 2012, orange diamond) and ACT (Sievers et al. 2013, cyan diamond) constraints on the tSZ power spectrum at ℓ = 3000.
Current usage metrics show cumulative count of Article Views (full-text article views including HTML views, PDF and ePub downloads, according to the available data) and Abstracts Views on Vision4Press platform.
Data correspond to usage on the plateform after 2015. The current usage metrics is available 48-96 hours after online publication and is updated daily on week days.
Initial download of the metrics may take a while.