Fig. 3
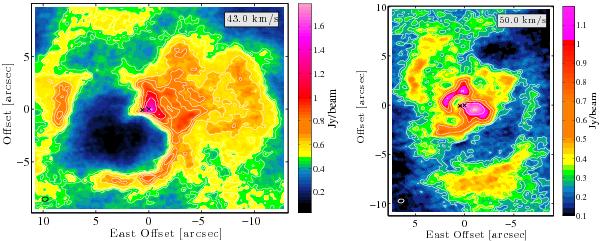
CO(3–2) map averaged over 2 and 3 km s-1 around vlsr = 43.0 and 50.0 km s-1, respectively, showing the bubble structure (left) and the spiral arcs (right) discussed in Sect. 3.2. The crosses mark the position of Mira A (west) and B (east). Contours are drawn at multiples of the rms noise level. The beam is shown in the lower left corner.
Current usage metrics show cumulative count of Article Views (full-text article views including HTML views, PDF and ePub downloads, according to the available data) and Abstracts Views on Vision4Press platform.
Data correspond to usage on the plateform after 2015. The current usage metrics is available 48-96 hours after online publication and is updated daily on week days.
Initial download of the metrics may take a while.