Free Access
Fig. 2
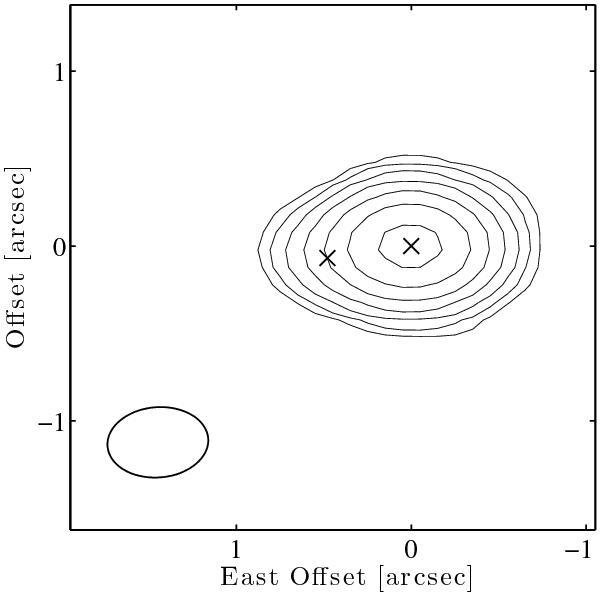
Continuum emission at 338 GHz with the current positions of Mira A (west) and B (east, marked by crosses). The contours are drawn at 5, 10, 20, 40, 80, 160, and 320 times the rms noise level at 0.6 mJy/beam. The beam is shown in the lower left corner.
Current usage metrics show cumulative count of Article Views (full-text article views including HTML views, PDF and ePub downloads, according to the available data) and Abstracts Views on Vision4Press platform.
Data correspond to usage on the plateform after 2015. The current usage metrics is available 48-96 hours after online publication and is updated daily on week days.
Initial download of the metrics may take a while.