Free Access
Fig. 1
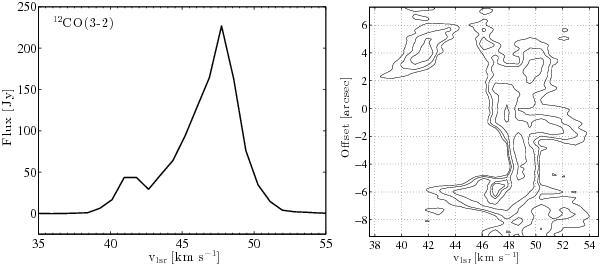
Left: ALMA CO(3–2) line profile generated using an 25′′ beam centered on Mira A. Right: position-velocity diagram showing the positional offset relative to the center of the bubble along a position angle of 38°, as a function of lsr velocity.
This figure is made of several images, please see below:
Current usage metrics show cumulative count of Article Views (full-text article views including HTML views, PDF and ePub downloads, according to the available data) and Abstracts Views on Vision4Press platform.
Data correspond to usage on the plateform after 2015. The current usage metrics is available 48-96 hours after online publication and is updated daily on week days.
Initial download of the metrics may take a while.